By Rachel Dawson
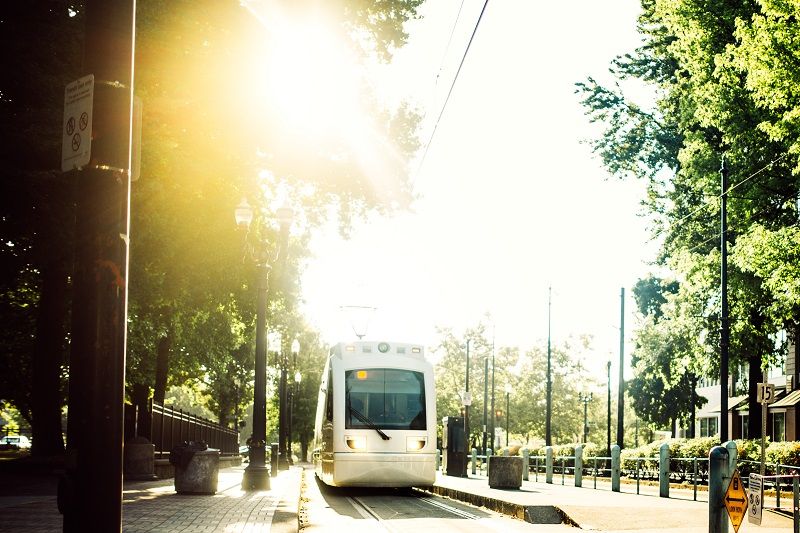
TriMet’s MAX Yellow Line first opened 15 years ago in May 2004. The Yellow Line’s Final Environmental Impact Statement (FEIS) made a myriad of predictions for the year 2020, which makes now the perfect time to reflect on what officials promised and what taxpayers and transit riders have since received.
Yellow Line History
The Yellow Line originated in 1988 as a 21-mile project connecting Vancouver, Washington with Downtown Portland and Clackamas Town Center. This plan was scrapped after Clark County voters defeated a proposal to raise $236.5 million in 1995 and Oregon voters turned down a $475 million regional ballot measure in 1998.
Not to be deterred by a lack of voter support, officials developed a shorter alternative in 1999 that would run from the Expo Center to Downtown Portland along Interstate Avenue. This alternative cost $350 million, 74% of which came from the Federal Transit Administration (FTA).
The construction of the new alternative was not put to a public vote. Portland officials instead expanded an urban renewal district to include the Interstate Avenue Corridor. Doing so allowed them to appropriate $30 million in tax increment funds to finance the rail that otherwise would have gone to other tax-collecting jurisdictions, including Multnomah County. The county commissioners opposed expansion of the urban renewal district, but the Portland City Council approved it anyway.
Looking back after fifteen years, we find that key promises made in the FEIS were never kept:
1. Frequency of Service
What We Were Promised: TriMet promised FTA in their Full-Funding Grant Agreement (FFGA) that peak-hour trains would arrive every ten minutes and off-peak trains every 15 minutes. The promised service according to the FEIS was supposed to reach eight trains during peak hours in 2020.
What We Received: Instead of having 10-15-minute headways between trains, the Yellow Line runs every 15 minutes during peak-periods and every 30 minutes during other parts of the day.
2. Travel Times
What We Were Promised: TriMet predicted travel times to be 24 minutes from Downtown Portland to the Expo Center and 19 minutes from Downtown Portland to N Lombard.[1] Light rail speeds were projected to reach 15.3 miles per hour (mph), and bus speeds were projected to be 13.2 mph in 2005.[2]
What We Received: Actual travel times are slower than predicted. It takes 35 minutes to take light rail from Downtown Portland to the Expo Center and 28 minutes from Downtown Portland to N Lombard, even though light rail has its own exclusive right of way. Actual travel times are 45.8% greater to the Expo Center and 47.4% greater to N Lombard. Actual light rail speeds in the corridor only hit 14.1 mph in 2005 while bus speeds averaged 16.1 mph—significantly faster than predicted.
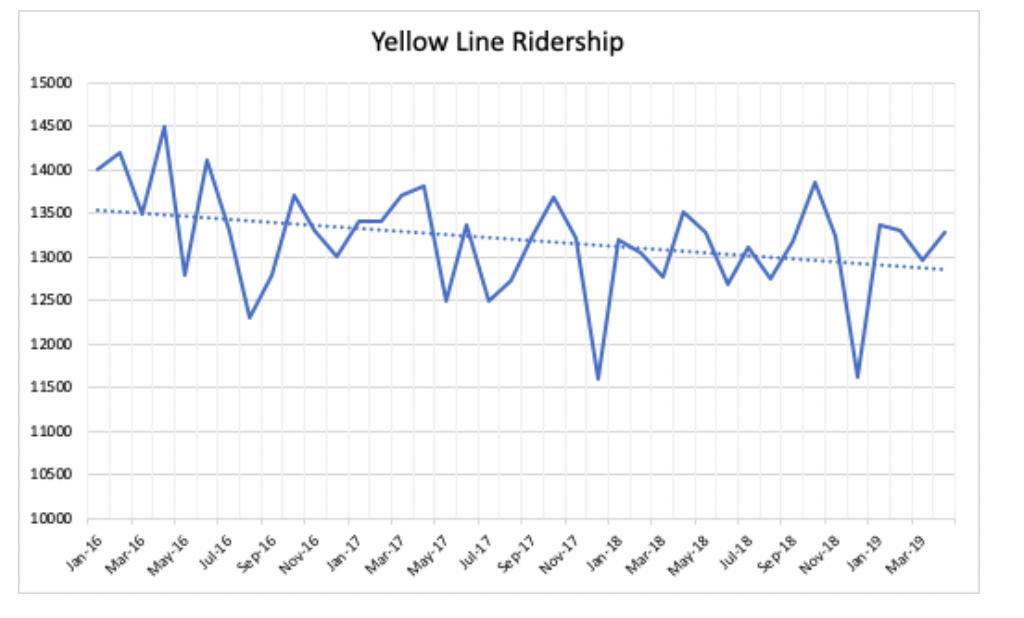
3. High ridership
What We Were Promised: The FEIS forecasted ridership in the corridor to dramatically increase with the building of the Yellow Line. By 2020 the line’s ridership was expected to have 18,100 average weekday riders.
What We Received: At no point since the Yellow Line opened has ridership met projected levels. In April 2019 ridership only reached 13,270, 26.7% less than projected. This number will not meet 2020 projected levels based upon the negative trend observed over the past three years. From March 2016 to March 2019 ridership levels decreased by 3.6%.
Lower than promised ridership isn’t unique to the Yellow Line; every TriMet rail forecast has been wrong, and always wrong on the high side.
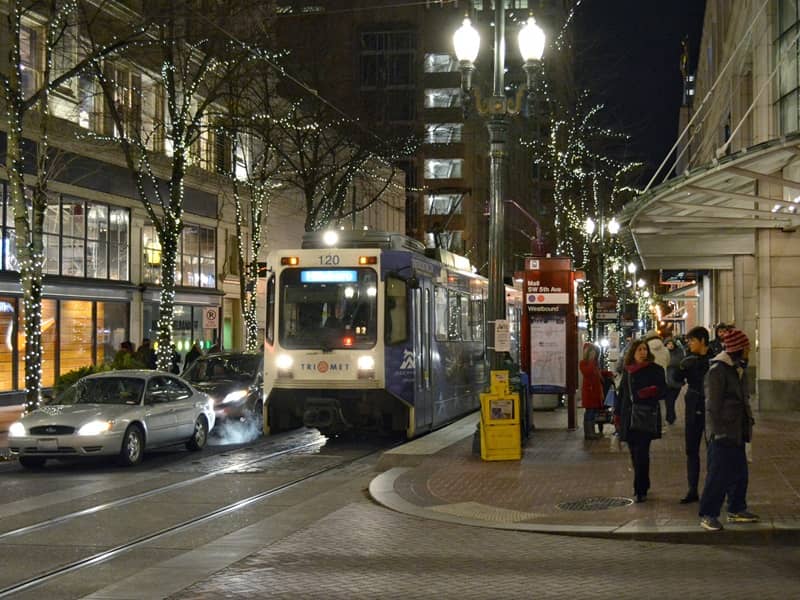
 Light Rail Is Not Superior to Bus Transit
The Yellow Line was expected to provide superior service compared to the no-build bus alternative. This forecast hasn’t panned out. The Yellow Line replaced Line #5, which if it were still operating, would have seven-minute headways between Vancouver and Downtown Portland. C-Tran express service was forecasted to have three-minute headways.[3]
Light rail does not reach any more people or businesses than Line #5 did. In fact, Line #5 had more stops along Interstate Avenue, meaning some riders now have a longer walking commute to the MAX stations.
TriMet bus service from Vancouver to Downtown Portland continues to be an option even after the Yellow Line’s construction. Line #6 was changed to pick up the link between Jantzen Beach and the Yellow Line’s Delta Park stop that Line #5 had previously serviced. It then continues down MLK Boulevard to the Portland City Center.
In Spring 2019, Line #6 saw 665 average weekday on/offs at Jantzen Beach and only 190 total on/offs at Delta Park. This means that the vast majority of Vancouver commuters on Line #6 opt to stay on the bus to Portland instead of transferring to the Yellow Line.
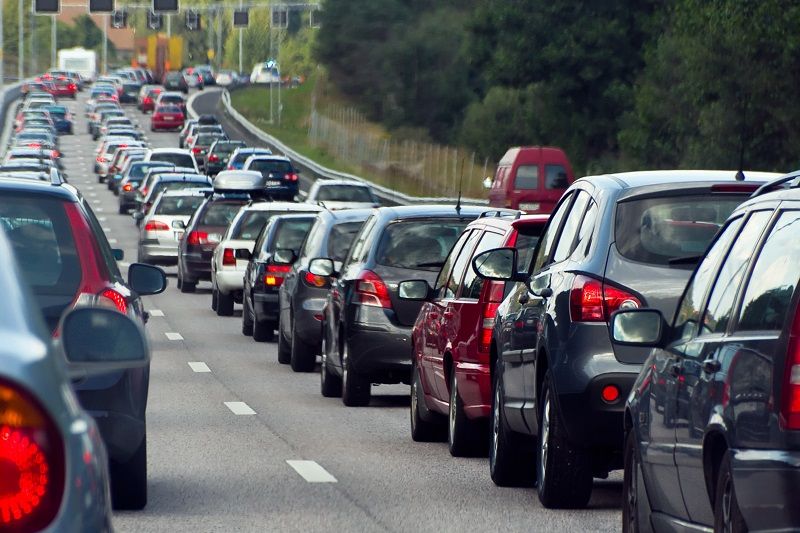
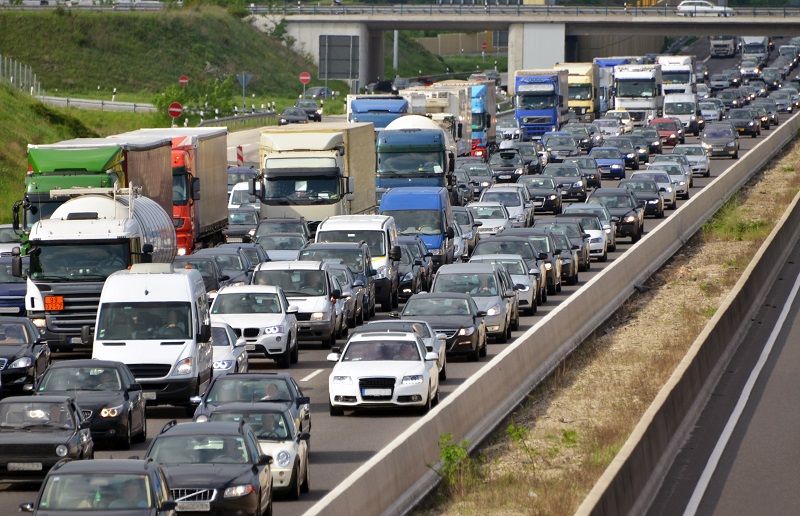
Given the Yellow Line’s history, we can expect the prospective SW Corridor light rail project to increase traffic, have fewer trains than promised, and have lower ridership than predicted. If ridership levels are 26.7% below forecast 15 years into service, why should the SW Corridor ridership estimate of 43,000 daily boardings be taken seriously? The FTA should not offer TriMet additional light rail funding in the future if TriMet is unable to honor its past promises.
TriMet may argue that service levels are below EIS forecasted levels due to a lack of funds. However, TriMet’s revenue increase in recent years tells otherwise. Between 1998 and 2018, passenger fares increased by 116% and tax revenue increased by 64%. TriMet’s payroll tax has been increasing since 2005 and will continue to go up every year until 2024. There is no issue with revenue; rather, the issue lies with light rail.
Moving forward, Metro and TriMet should focus on creating a more reliable bus network that runs on an already built road system. Doing so will benefit riders and taxpayers alike.
__________________________
[1] Federal Transportation Authority, Interstate MAX Before and After Study, 2005, 2-5.
[2] Id, 2-10.
[3] North Corridor Instate MAX Light Rail Project, Final Environmental Impact Statement Executive Summary, October 1999, S-17.
Rachel Dawson is a Policy Analyst at Cascade Policy Institute, Oregon’s free market public policy research organization.
Click here for PDF version:


John Ley
As metro area citizens are faced with the renewed effort to replace the Interstate Bridge, most of us believe it is a resurrection of the Columbia River Crossing (CRC). As an Oregon Supreme Court Justice correctly stated, it was “a light rail project in search of a bridge”.
In the current discussion, both Oregon Governor Kate Brown and Washington Governor Jay Inslee have demanded, “no light rail, no bridge“. That just echos what happened in the CRC, as Oregon’s Governor Kitzhaber issued the original “no light rail, no bridge” demand, which Jay Inslee promptly repeated.
Is there a need for light rail, or ANY form of mass transit on a replacement Interstate Bridge?
For added perspective, here is a graphic showing MAX light rail ridership from 2001 to 2016.
http://johnley.us/wp-content/uploads/2019/01/MAX-Average_Daily_Ridership_TriMet_Light_Rail_Jan_2002_thru_2016-2.png
More importantly, CTran offers the only bus service across the Columbia River into Portland. They offer SEVEN different “express” bus lines, using either the I-5 corridor or the I-205 corridor. How is CTran’s ridership into Portland fairing? Badly.
Here’s the Columbian graphic showing the decline in cross-state express bus ridership.
http://johnley.us/wp-content/uploads/2017/11/Ctran-ridership-down-crossings-up-9-percent.png
The Bi-state C-Tran ridership has continued to drop the last two years. In the fall of 2018, CTran told me they had just 1,422 riders on an average day. That’s on SEVEN different bus lines; which means an average of just over 200 riders per day per express bus line.
When compared to the 310,000 vehicles crossing the Columbia River on the two bridges on an average day, that means 0.45% or less than half of one percent use the bus.
THANK YOU for your timely and extremely appropriate report!
Cascade Policy Institute
John, thank you for your comment. You bring up several good points. The new Interstate Bridge discussions will likely lead to Oregon officials demanding another light rail boondoggle, which Vancouver voters have shown more than once they do not want.
It is long past time for a new bridge (not a new light rail) across the Columbia. Officials should consider one west of the Interstate Bridge that can connect with HWY 26 and perhaps one east of the Glenn Jackson Bridge.